Top of the Crops
DESCRIPTION
«Top of the Crops» is interactive data-visualization especially made for 360° fulldome environments like planetariums. It was developed during the course «Immersive Data Visualizations» at University of Applied Sciences Potsdam, supervised by Prof. Boris Müller. The visualization was tested and fine-tuned at Urania Potsdam, a planetarium, which collaborates with the University of Applied Sciences Potsdam to create immerseive data visualizations and fulldome movies.
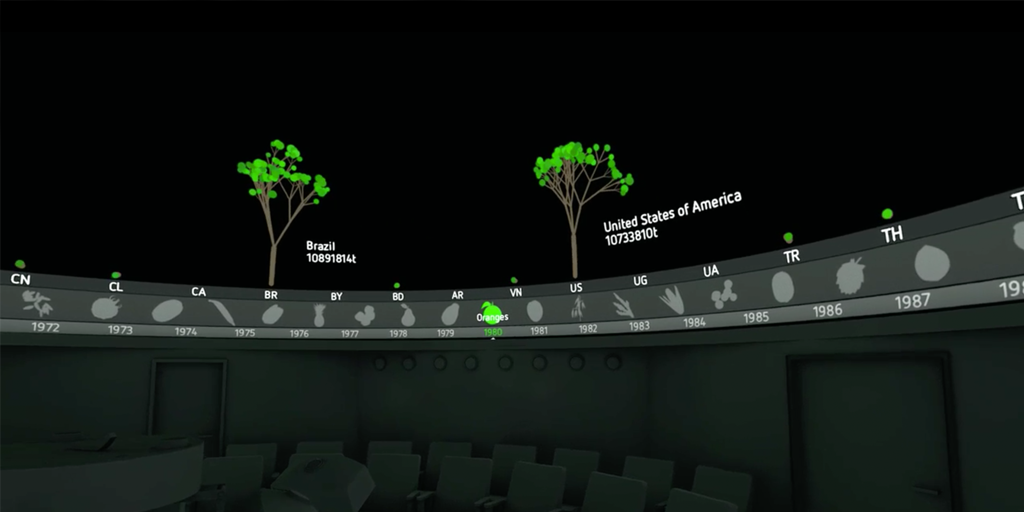
The backbone of the visualization is a data set from the UN, which contains the global crop production per country within the last 40 years. Viewers are encouraged to find out where their favorite crops are being produced and how production changes over time.
To navigate through the different crops and years, a 3DConnexion SpaceNavigator is being used. Turning its y-axis turns the active navigation ring, tilting the y-axis switches the navigation ring. In a live test the navigation was easily understood, even by children. The height of the generative trees illustrates the production quantity of the selected crop in that year. The trees are generated using L-Systems and look different each time the visualization is ran. The positions of the leaves and branches are individually stored, making it possible to let them react to the virtual wind, which could potentially transport another information layer as well. In this version the wind as well as the background-audio were just designed to round off the overall atmosphere.
The visualization was programmed in Java using the Processing framework and a custom CSV-library.
If you want to learn more about the collaboration between Urania Potsdam and University of Applied Sciences Potsdam, here is a short video (German): «360° Kuppelprojektion an der FHP» on Vimeo.